Distribution of Returns
See how your investment timeframe impacts the likelihood of achieving your target rate of return.
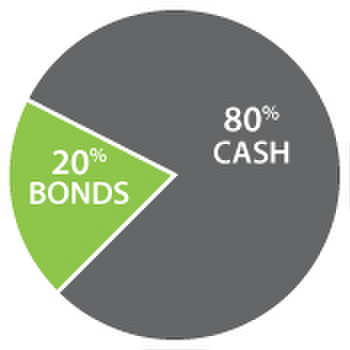
Moderate Portfolio
|
Distribution of Annual Rates of Return
1 Year Holding Periods
1 Year Holding Periods
Negative
Returns
Returns
0% to
4.99%
4.99%
5% to
7.99%
7.99%
8% to
9.99%
9.99%
10% to
11.99%
11.99%
12% to
14.99%
14.99%
15% to
19.99%
19.99%
20% &
over
over
Assumptions
Best, worst and average returns are annual compound rates of return for various holding periods and portfolio combinations from 1951 to 2025 inclusive. Portfolios were rebalanced to their original allocation every twelve months. Stocks are represented by the S&P/TSX Total Return Index, bonds by the Canada 10 Year Total Return Government Bond Index and cash by the Canada Total Returns TBill Index.
Disclaimer